How to use the AI Traffic & Revenue Analytics?
Understand where your AI traffic comes from and which products generate revenue
Written By Tom van den Heuvel
Last updated 10 months ago
Overview
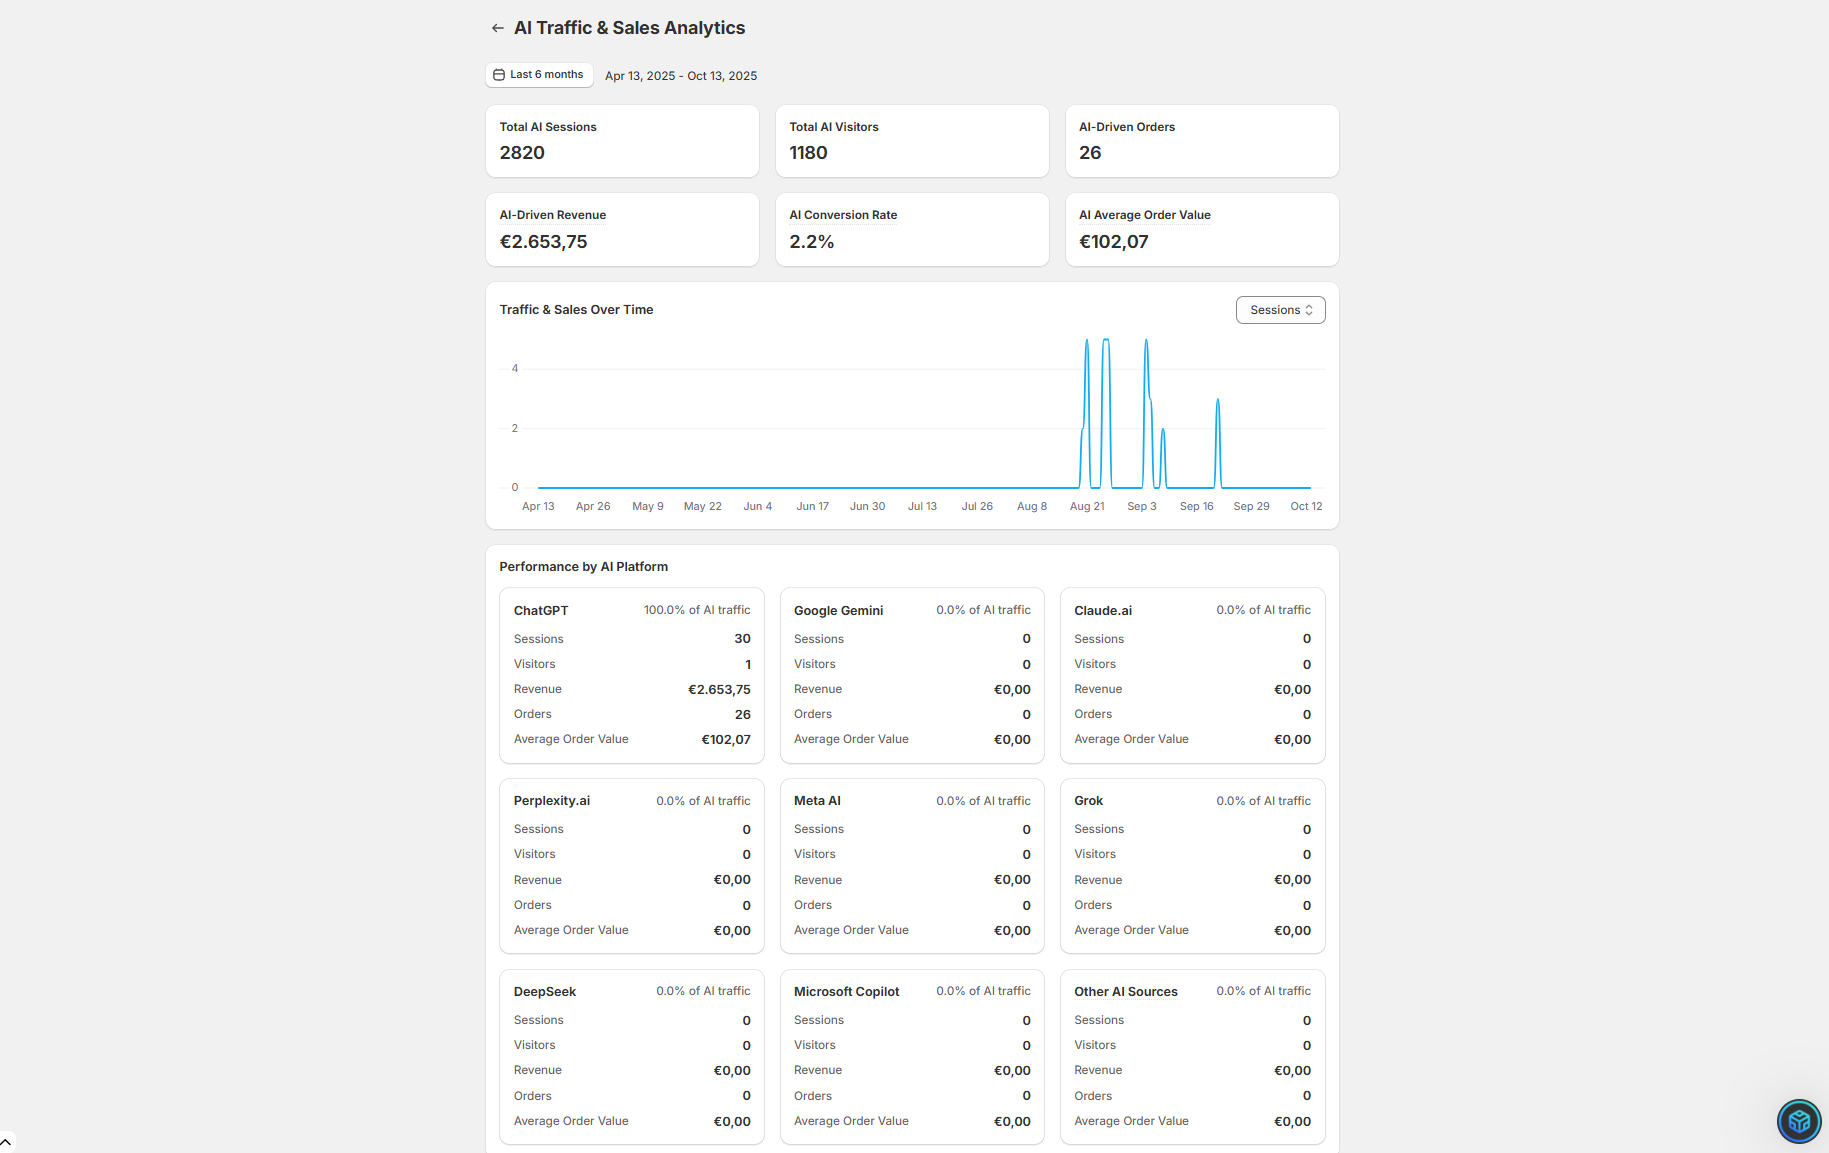
The AI Traffic & Revenue dashboard automatically tracks all traffic and revenue coming from AI platforms. You don’t need to set anything up—the system works in the background and uses first-touch attribution to connect visits and purchases to AI sources.
Key metrics you’ll see:
✅ Total AI Sessions – Visitors arriving from AI platforms
✅ AI-Driven Revenue – Revenue attributed to AI traffic
✅ AI-Driven Orders – Number of orders from AI sources
✅ AI Conversion Rate – Compare AI traffic conversion vs organic traffic
✅ Average Order Value (AOV) – Compare AI traffic AOV vs overall store average
Pro Tip: Use this data to identify which AI sources and pages drive the most revenue, then replicate that strategy across other products.
Platform Performance
Track performance across major AI platforms including:
ChatGPT
Claude.ai
Perplexity.ai
Google Gemini
Meta AI
Grok
DeepSeek
Microsoft Copilot
Other emerging AI sources
You’ll see sessions, unique visitors, revenue, orders, conversion rates, and AOV for each platform.
Top AI-Driven Pages
One of the most powerful features is Top AI-Driven Pages.
What it shows:
Product and page-level traffic from AI sources
Revenue generated per page
Primary AI platform driving traffic to each page
Session quality and engagement metrics
Why it matters: Identify your top-performing products and pages, then optimize other products similarly to increase AI-driven sales.
Revenue Attribution
StoreRank.ai uses first-touch attribution to track AI traffic:
A user discovers a product through an AI platform.
They visit your store (via AI referrer or UTM).
Any resulting purchase is attributed to that AI source.
Return visits from the same customer maintain AI attribution within a 30-day window.
Attribution windows:
Immediate: Purchases in the same session
7-day: Purchases within one week
30-day: Full attribution window for longer-term tracking
Return customers: Ongoing attribution for repeat buyers
Tip: First-touch attribution ensures you give credit to the AI source that originally discovered your product.
Traffic Analysis
The dashboard lets you analyze AI traffic in detail:
Performance by AI platform:
Sessions and session percentage
Unique visitors
Revenue and revenue percentage
Total orders
Average order value
Conversion rate comparison
AI Platform Comparisons:
Which platforms drive the highest-value traffic
Conversion rate differences by platform
Product category preferences
Geographic distribution of AI traffic
Understanding the Data
What counts as AI traffic:
Direct referrals from AI platforms
Visits with AI-specific UTM parameters
Sessions following AI bot crawls
Voice search or AI assistant traffic
Pro Tip: Monitor your Top AI-Driven Pages regularly. Updating product content and FAQs can further improve AI visibility and citations.
Next Steps & Best Practices
Check your dashboard weekly to see which AI platforms and products drive the most revenue.
Use Top AI-Driven Pages as benchmarks to optimize other products similarly.
Re-optimize content every 90 days, AI prefers fresh, updated content and market trends change quickly.
Combine insights with AI Product Content Optimizer to maximize visibility and conversions.
🎉 Congratulations!
You now know how to monitor AI traffic and revenue, identify your best-performing pages, and leverage this data to boost AI-driven sales.